5 Takeaways From M+R’s Online Fundraising ‘Benchmarks’
NonProfit PRO
APRIL 30, 2024
M+R's annual “Benchmarks” report revealed five key takeaways on nonprofits' digital fundraising strategies.
This site uses cookies to improve your experience. By viewing our content, you are accepting the use of cookies. To help us insure we adhere to various privacy regulations, please select your country/region of residence. If you do not select a country we will assume you are from the United States. View our privacy policy and terms of use.
NonProfit PRO
APRIL 30, 2024
M+R's annual “Benchmarks” report revealed five key takeaways on nonprofits' digital fundraising strategies.
NonProfit PRO
APRIL 7, 2023
ASI has released the results of its global 2023 Membership Performance Benchmark Survey. The eigth annual survey, conducted in late 2022, examines membership trends, including recruiting, retention, and engagement.
This site is protected by reCAPTCHA and the Google Privacy Policy and Terms of Service apply.
NonProfit PRO
NOVEMBER 8, 2023
Nonprofits are at a pivotal transformation point and are focusing on their long-term strategic resilience following a few years of readily available federal funding, according to BDO’s seventh annual "Nonprofit Standards" benchmarking survey.
NonProfit Leadership Center
MAY 1, 2023
The M+R Benchmarks Study is an annual report that highlights the latest nonprofit data and trends in digital fundraising and marketing. Findings from the 2023 M+R Benchmarks study reveal four important insights all nonprofit organizations should know.
NonProfit PRO
JULY 8, 2021
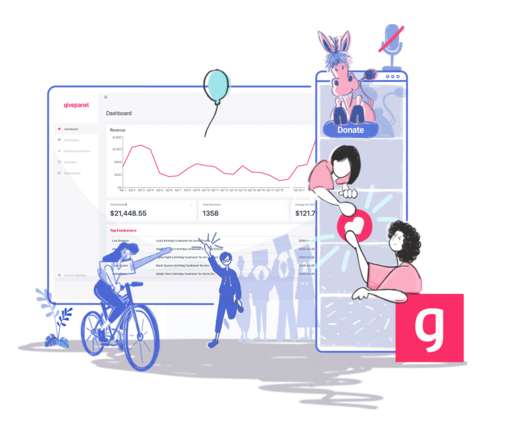
We’re going to review the Facebook Fundraising Benchmarks Report 2020 by GivePanel. Let’s clarify what “Facebook fundraising” refers to. It’s probably exactly what you think it is: when someone on Facebook starts a fundraiser to support your nonprofit. But there’s some fine print here.
NonProfit PRO
MAY 4, 2023
Shortly after the nonprofit sector learned that both overall donors and donor dollars had declined, M+R confirmed the downward trends with M+R Benchmarks 2023, noting a 4% median decline in year-over-year online revenue for nonprofits.
NonProfit PRO
MAY 5, 2022
One of my favorite statistics were just published: the M+R Benchmarks 2022. Not surprisingly, in the second year of the pandemic with still few in-person events, online giving grew, although not by as much as you’d expect.
NonProfit PRO
JUNE 21, 2021
Download the benchmark study for an in-depth look at 157 GivePanel charities across the US, UK, and Ireland. Knowing the different types of fundraising and donations that can happen is a scary task. Check out our 9 Key Findings on Facebook Fundraising to help you get these difficult questions answered.
Kivi's Nonprofit Communications Blog
OCTOBER 25, 2021
Email marketing platform GetResponse has released some email marketing benchmarks data you might be interested in. This is why we recommend you start your own benchmarks to better track trends and shifts in YOUR data. This is why we recommend you start your own benchmarks to better track trends and shifts in YOUR data.
NonProfit PRO
JUNE 10, 2021
The 2021 Nonprofit Leaders Survey is designed to elicit candid feedback on the trends, outlooks and greatest challenges nonprofits are facing today and provide valuable benchmarking data to help nonprofit leaders uncover the greatest areas of opportunity and growth in the wake of the COVID-19 crisis.
NonProfit PRO
JANUARY 17, 2024
Gravyty released its Donor Engagement Benchmark Report, which highlighted challenges fundraisers faced in 2023, and focuses for 2024.
NonProfit PRO
APRIL 26, 2021
The importance of converting those one-time donors to give monthly in 2021 is crucial for your overall retention. That will really help you grow your fundraising revenue. .
NonProfit PRO
DECEMBER 18, 2023
Blackbaud unveiled its "Blackbaud Luminate Online Benchmark Report 2022" and "Peer-to-Peer Benchmark Report 2022."
NonProfit PRO
APRIL 3, 2024
The “2024 Digital Fundraising Benchmark Report” explored how a digital-first approach affected fundraising. Here are three takeaways.
NonProfit PRO
JANUARY 22, 2024
Download the report to glean insights from 939 fundraising professionals, benchmark your nonprofit's success, see where other nonprofits plan to invest their budget, learn how the nonprofit sector feels about AI, and more.
NonProfit PRO
DECEMBER 8, 2023
Our CIS Hardened Images® come pre-hardened to the security recommendations of the CIS Benchmarks™. Need to strengthen you public sector organization's cloud security? They help you defend against cloud-based threats for just $0.02 per compute hour.
NonProfit PRO
JANUARY 19, 2023
TechSoup and Tapp Network released the results of the 2022-2023 Nonprofit Digital Marketing Benchmark Report, which reveals the strategies used by over 100 nonprofits in 2022 and their plans for improvement in 2023.
iMarketSmart
MAY 4, 2020
The 2020 Major Gift Benchmark Study asked people working in nonprofit organizations (n=580) what they consider to be a major gift, how they are staffed to raise major gifts, the types of information used to identify major gift prospects, and more. And now, here are the benchmarks you really should know and share. Bonus benchmark.
NonProfit PRO
FEBRUARY 16, 2023
Industry benchmarks reveal just 23% of first-time online donors return, compared to 64% of existing online donors. And over the last decade, nonprofits have continued to raise more funds from fewer donors. These statistics underscore the importance of not only keeping your donors, but also acquiring new ones
Kivi's Nonprofit Communications Blog
APRIL 26, 2021
The M+R Benchmarks Study for 2021 came out late last week. The post 8 Things I Found Interesting in the 2021 M+R Benchmarks Study appeared first on Nonprofit Marketing Guide. I recommend you check out the full report for yourself, but these are the (sometimes random) things I found most interesting. What did you find surprising?
NonProfit PRO
APRIL 12, 2023
The new report provides a look at nonprofit email benchmarks for both large and small organizations. With data from nearly 1,500 nonprofits, nonprofit software provider Neon One has evaluated more than 37,000 email campaigns totaling more than 157 million individual emails for “The Nonprofit Email Report.”
Nonprofit Tech for Good
MAY 7, 2024
Rival IQ Social Media Industry Benchmark Report ] Nonprofits have an average engagement rate of 0.066% on Facebook. Rival IQ Social Media Industry Benchmark Report ] 53% of nonprofits spend on social media advertising. M+R Benchmarks Report ] Facebook/Meta results in an average return on ad spend (ROAS) of $0.48 on TikTok. [
NonProfit PRO
AUGUST 11, 2022
Recent donorCentrics Sustainer Benchmarking studies show that some 6% of monthly donors will make at least one extra gift a year when asked, so not asking is definitely leaving money on the table. Here's how to go about it.
NonProfit PRO
MAY 31, 2023
Cherian Koshy of Merit America and Tim Sarrantonio of Neon One join the NonProfit Voice to discuss email benchmarks for the nonprofit sector.
Nonprofit Tech for Good
MARCH 20, 2024
M+R Benchmarks ] Online Giving The average gift made on desktop devices is $194; for mobile users, the average gift is $94. [ M+R Benchmarks ] 25% of online donations were made on a mobile device in 2022. [ M+R Benchmarks ] 30% of all online giving occurs in December and 10% occurs in the last three days of the year.
NonProfit PRO
NOVEMBER 9, 2022
Despite a year of global economic turmoil characterized by inflation and the looming possibility of a downturn, nonprofits not only achieved revenue growth but expanded their impact, according to BDO’s annual Nonprofit Standards benchmarking survey.
Kivi's Nonprofit Communications Blog
MAY 2, 2018
The M+R Benchmarks Study came out last week. I also want to encourage you to check out their handy interactive Benchmark Yourself feature that allows you to add your stats for fundraising and advocacy and other metrics to compare with the Benchmarks in the report. Happy Benchmarking! They analyzed the results of almost 4.7
Fundraising Report Card
FEBRUARY 19, 2019
Measuring your organization’s fundraising performance against itself (year over year analysis for example), is the first step towards benchmarking. The post Fundraising Benchmarks — What Can You Learn from $40B in Donations? After that comes peer comparison. appeared first on Fundraising Report Card.
NonProfit PRO
APRIL 7, 2022
Women Business Collaborative (WBC) and 50/50 Women on Boards (50/50WOB) released "Women Leading Boards," a new benchmark report for tracking board diversity. The report shows that 2021 was a watershed year for board diversity, with women representing 42.5% of all new appointees for public companies in the U.S. in 2021.
Affnetz
APRIL 30, 2024
Benchmarking: Benchmarking donor retention rates against industry standards helps nonprofits can compare their retention rates with sector averages.Understanding where one stands in relation to industry benchmarks offers context for setting realistic goals and refining fundraising strategies.
iMarketSmart
APRIL 20, 2018
My team took all the data from our Fundraising Report Card (2,600 organization’s transactions) and built a nifty little live benchmarking app. The post BENCHMARKING YOURSELF: Ever wonder how you’re doing compared to others? Now you can do that in seconds, for FREE! You can check it out here at no cost. LIKE THIS BLOG POST?
EveryAction
MAY 15, 2019
Every year, nonprofit consultants M+R release their annual Benchmarks report , which provides an overview of digital trends in the sector. The big sound bite from this year’s Benchmarks Report is that total online revenue grew by only 1% in 2018. Online revenue growth has plateaued.
iMarketSmart
OCTOBER 5, 2017
On today’s episode we discuss the 2017 Major Gifts Fundraising Benchmark Study. The post 2017 Major Gifts Fundraising Benchmark Study – Episode 13 appeared first on MarketSmart, LLC |. This study is the first of its kind by focusing on major gifts. You can download the report at [link].
NonProfit PRO
MAY 31, 2023
Cherian Koshy of Merit America and Tim Sarrantonio of Neon One join the NonProfit Voice to discuss email benchmarks for the nonprofit sector.
Getting Attention
NOVEMBER 18, 2015
The annual results report provides concrete benchmarks for your marketing approach and the proof points you need to lobby for the resources you need to do marketing right. Your input is vital to generating the benchmarks and proof points we all need to do marketing even better. Give 10— take the survey today.
Fundraising Report Card
JANUARY 23, 2018
Instead, we wrote some complex algorithms and made a free website to talk about nonprofit fundraising … Continue reading "New Year, New Benchmarks: How Does Your Organization Stack Up?". The post New Year, New Benchmarks: How Does Your Organization Stack Up? appeared first on Fundraising Report Card.
The Agitator
APRIL 20, 2016
The latest M+R Benchmarks Study was released yesterday, providing a valuable look at trends in the digital fundraising arena.
Nonprofit Tech for Good
MAY 11, 2023
Staying current with the latest digital marketing and fundraising trends and benchmarks is essential for nonprofits. Benchmarks Study 2023 :: Download [US] Published by M+R 2. Communications Benchmark Report 2022 :: Download [UK] Published by the CharityComms 11.
Care2
MARCH 23, 2012
The 2012 eNonprofit Benchmark study comes out April 5 th and is packed with great data that highlights key online fundraising and advocacy response rates as well as social media metrics. Not to worry, you can get a sneak peak at some of they key benchmarks in this terrific infographic that illustrates: Fundraising.
Care2
FEBRUARY 7, 2014
The latest Blackbaud Online Marketing Benchmark Study for Nonprofits analyzed data from more than 4,000 nonprofits to provide the largest analysis in online giving data. Marketing Research Nonprofit Benchmark Studies Online Fundraising Trends' This just in! According to the report, overall giving grew 4.9% increase in online giving.
Kivi's Nonprofit Communications Blog
JANUARY 19, 2017
These are some of the key takeaways from the new Luminate Online Benchmark Report 2016 by Blackbaud. As with all benchmarks, use this report to understand how your org compares to peers (even aspirational peers!) As with all benchmarks, use this report to understand how your org compares to peers (even aspirational peers!),
iMarketSmart
AUGUST 21, 2015
Anyway, I stumbled on this link that houses 24 benchmark reports on fundraising. Share this post: The post 24 amazing benchmark reports on fundraising all in one place appeared first on MarketSmart |. If you’re like me, you like to noodle data and scratch your head a lot. Related Posts.
Care2
MAY 24, 2013
Last month we reported that online fundraising response rates declined 27% between 2011-2012, according to the eNonprofit Benchmark study. The latest Blackbaud Online Marketing Benchmark Study for Nonprofits that analyzed data from 500 organizations using the Luminate platform also indicated a steep decline in fundraising response rates.
Nonprofit Tech for Good
JULY 4, 2023
M+R Benchmarks ] Organic traffic (website traffic generated by unpaid search results) comprised 38% of all nonprofit website visits in 2022. [ M+R Benchmarks ] The top three sources of website traffic are: Direct (22%) Organic Search (17%) Social (16%). M+R Benchmarks ] Average online gift and mobile giving. per visitor. [
Expert insights. Personalized for you.
We have resent the email to
Are you sure you want to cancel your subscriptions?
Let's personalize your content